
When you measure noise levels with a sound level meter, you measure the intensity of noise called decibel units (dB). A sound meter uses a display with a decibel range and resolution to approximate the ear’s dynamic range, usually the upper range rather than the quiet part. If you think about it, it would be very difficult to manufacture a sound level meter that had a linear performance, especially bearing in the mind the range of noise sources to be measured in a work environment. It would be tricky to keep an eye on those 14 digits varying in front of you! So, to express levels of sound meaningfully in numbers that are more manageable, a logarithmic scale is used, using 10 as the base, rather than a linear one. This scale is called the decibel scale.
Understanding the Decibel Scale
The human ear is an extremely versatile and amazing hearing device. It has a clever in-built mechanism that reduces its own sensitivity as the sound level rises and it also has the remarkable ability to handle an enormous range of sound power levels. It can hear the sound of a pin dropping close-by as well as the roar of a jet engine far away.
Although the ear can distinguish the rise in level between one or two pins dropping, it cannot distinguish between 10,000,000,000,000 pins and 10,000,000,000,001 pins or even 10,100,000,000,000 because it is not a linear device. It can, however, distinguish the significant multiplying of the energy of the sound.
| Change in dB | Change in sound energy |
|---|---|
| 3 dB increase | sound energy is doubled |
| 3 dB decrease | sound energy is halved |
| 10 dB increase | sound energy is increased by a factor of 10 |
| 10 dB decrease | sound energy is decreased by a factor of 10 |
| 20 dB increase | sound energy is increased by a factor of 100 |
| 20 dB decrease | sound energy is decreased by a factor of 100 |
Did you know: A logarithmic scale is used when there is a large range of quantities. It is based on orders of magnitude, rather than a standard linear scale, so each mark on the decibel scale is the previous mark multiplied by a value.
On the decibel scale, the quietest audible sound (perceived near total silence) is 0 dB. A sound 10 times more powerful is 10 dB. A sound 100 times more powerful than near total silence is 20 dB. A sound 1,000 times more powerful than near total silence is 30 dB, 40 dB and so on.
Although the ear can distinguish the rise in level between one or two pins dropping, it cannot distinguish between 10,000,000,000,000 pins and 10,000,000,000,001 pins or even 10,100,000,000,000 because it is not a linear device. It can, however, distinguish the significant multiplying of the energy of the sound. When this sound is doubled this equates to a rise of 3dB (decibels), using a logarithmic scale. In other words: every increase of 3 dB represents a doubling of sound intensity or acoustic power. In a work context, this means that a small increase in the number of decibels results in a huge change in the amount of noise and, as such, the potential damage to a person’s hearing. The use of the dB unit makes it easier to measure decibels and monitor sound changes if we use these rules. The table below summarises this:
| Change in dB | Change in sound energy |
|---|---|
| 3 dB increase | sound energy is doubled |
| 3 dB decrease | sound energy is halved |
| 10 dB increase | sound energy is increased by a factor of 10 |
| 10 dB decrease | sound energy is decreased by a factor of 10 |
| 20 dB increase | sound energy is increased by a factor of 100 |
| 20 dB decrease | sound energy is decreased by a factor of 100 |
How to Add Decibels Together
Because sound pressure levels in decibels (dB) use a logarithmic scale we can’t just add two dB readings together. For instance, in a factory, if one machine’s noise level is measured at 90 dB(A) and then we start up a second machine also measuring 90 dB(A), the resulting noise is not 180 dB(A), instead, because we know that 3dB represents a doubling of the noise, 90dB + 90dB = 93dB.
| Difference between two noise levels | Amount to add to the higher of the two noise levels (dB or dB(A)) |
|---|---|
| 0 | 3.0 |
| 0.1 – 0.9 | 2.5 |
| 1.0 – 2.4 | 2.0 |
| 2.4 – 4.0 | 1.5 |
| 4.1 – 6.0 | 1.0 |
| 6.1 – 10 | 0.5 |
| 10 | 0.0 |
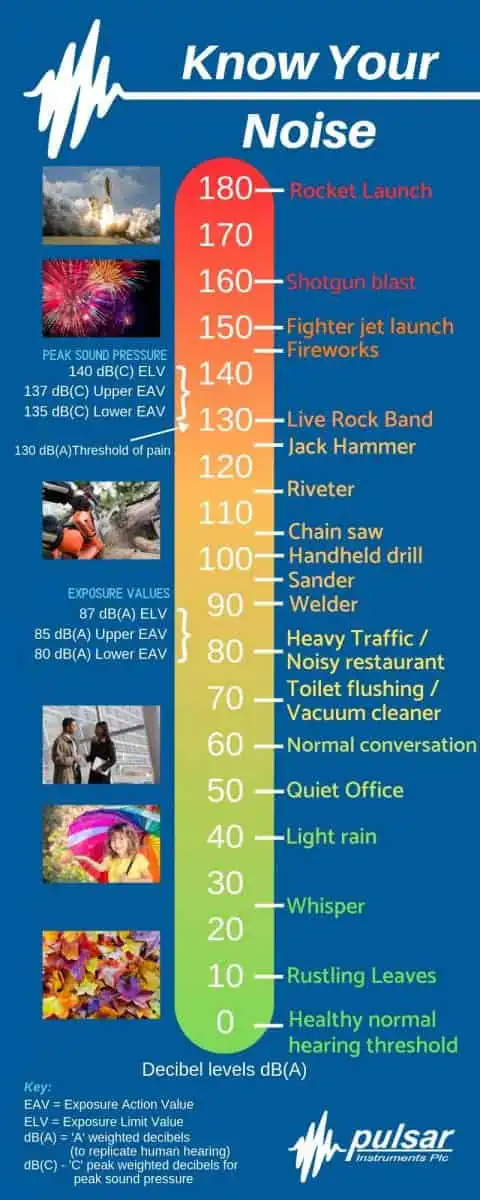
Decibel Chart of Common Sounds
Find out decibel levels of common noises like power tools, objects and places with our decibel chart. The chart gives examples of how loud some of the common tools and objects we may see (and hear!) in our lives are.
Maximum Safe Noise Exposure Times
The table below gives guidance on how long it is safe for someone to be exposed to different noise levels without wearing hearing protection.
| Noise Level dB(A) | Maximum Exposure Time (in an 8-hour working day/shift) |
|---|---|
| 85 | 8 hours (Wearing hearing protection in the workplace is mandatory) |
| 88 | 4 hours |
| 91 | 2 hours |
| 94 | 1 hour |
| 97 | 30 minutes |
| 100 | 15 minutes |
| 103 | 7.5 minutes |
| 106 | 3.7 minutes |
| 109 | 112 seconds |
| 112 | 56 seconds |
| 115 | 28 seconds |
| 118 | 14 seconds |
| 121 | 7 seconds |
| 124 | 3 seconds |
| 127 | 1 second |
| 130 – 140 | Less than 1 second |
| > 140 | NO EXPOSURE TIME (Threshold of pain) |
Note: Maximum exposure time halves with every increase of 3dB(A) – this is the exchange level used in Europe. In the USA a 5dB exchange level is used.
Jobs With High Noise Exposure
| Industry | Typical Noise Sources | Approx Noise Levels |
|---|---|---|
| Construction | Jackhammers, drills, grinders | 90–130 dB |
| Manufacturing | Presses, grinders, metal cutting | 85–125 dB |
| Agriculture | Chainsaws, tractors, wood chippers | 90–120 dB |
| Armed Forces | Explosions and firefights | 140–180 dB |
| Dental Workers and Hospital Surgeons | Saws, drills and hammers | 85–110 dB |
| Teachers | Student chatter, shouting | 75–85 dB |
| Music and Entertainment | Concerts, DJs, orchestras | 90–120 dB |
| Airport Ground Control Staff | Jet engines, ground equipment | 120–140 dB |
| Emergency Services | Sirens and alarms | 100–140 dB |
| Hairdressers | Hairdressing | 85–90 dB |

